Inventory Carried, Capital Buried: The True Financial Weight of Overstocking in Global Supply Chains
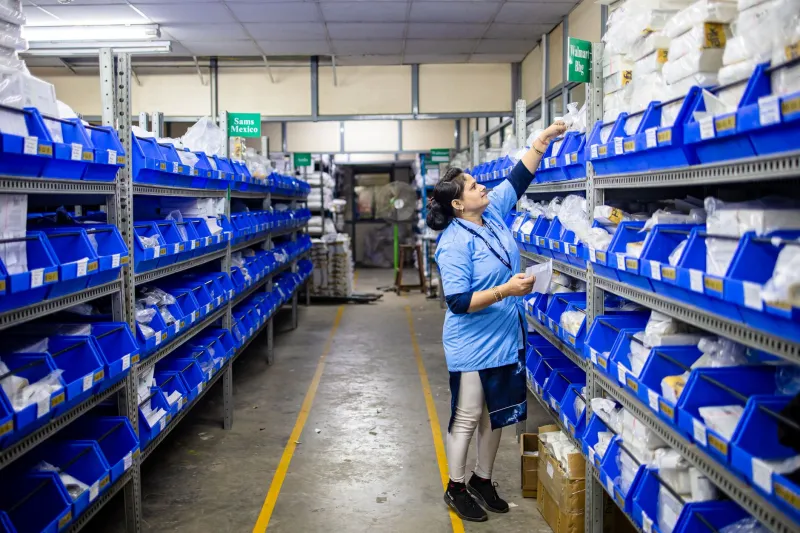
The Buffer That Became a Burden
For many US manufacturers sourcing from international partners, safety stock started as a reasonable precaution. Lead times are long. Ocean freight is unpredictable. Port congestion happens. The logic of holding extra inventory seemed prudent—until it became a permanent operating condition.
What began as a buffer has, for a significant number of mid-market manufacturers, calcified into a structural cost problem. Warehouses hold more than they need to. Cash sits motionless on shelves. And the full financial weight of that inventory rarely appears on anyone's executive dashboard in a way that demands attention.
This article is about making that weight visible—and actionable.
Why the True Cost of Excess Inventory Is Almost Always Underestimated
The most common mistake finance teams make when evaluating inventory levels is limiting the analysis to storage costs alone. A pallet in a third-party warehouse has a line-item fee, and that fee gets recorded. But the complete cost picture is substantially broader.
Carrying costs typically encompass several categories that, when aggregated, can represent 20 to 35 percent of the inventory's value on an annualized basis. These include:
-
Capital opportunity cost: Every dollar tied up in unsold inventory is a dollar unavailable for equipment upgrades, workforce development, or revenue-generating investment. For companies carrying $5 million in excess stock, the opportunity cost alone—measured against even a conservative internal rate of return—can run into six figures annually.
-
Insurance and taxes: Inventory is a taxable asset in many US states, and it must be insured. Both costs scale directly with the volume held.
-
Handling and labor: Stock doesn't sit passively. It gets moved, counted, inspected, and reorganized. Labor costs associated with managing excess inventory are real and recurring.
-
Obsolescence and spoilage: In industries where product cycles are short—consumer electronics components, fashion-adjacent goods, or anything subject to regulatory revision—excess inventory carries meaningful obsolescence risk. A product that was current eighteen months ago may be unsellable today.
-
Working capital drag: Perhaps the most consequential impact. Excess inventory suppresses free cash flow, constrains credit flexibility, and can limit a company's ability to respond to market opportunities or weather demand downturns.
When these factors are properly combined, the cost of overstocking a global supply chain is not a minor inefficiency. It is a sustained tax on operational performance.
The International Dimension: Why Global Supply Chains Amplify the Problem
Overstocking is a universal supply chain challenge, but international sourcing relationships create specific conditions that make it worse.
Long lead times—often 60 to 120 days for ocean freight from Asia or the Middle East—create a planning horizon that encourages conservative, high-buffer ordering. When a procurement team cannot reorder and receive goods quickly, the rational response is to hold more. The problem is that this rational response, multiplied across product lines and supplier relationships, compounds into structural excess.
Minimum order quantities (MOQs) imposed by overseas manufacturers further distort inventory levels. A factory in Southeast Asia may require a 10,000-unit minimum on a product that a US distributor realistically sells at 3,000 units per quarter. The math forces an overstock condition from the very first purchase order.
Additionally, demand forecasting becomes less precise over longer planning horizons. A forecast made 90 days in advance to align with international production schedules is inherently less accurate than one made three weeks out. The further into the future a manufacturer must commit, the wider the error band—and the more likely it is that actual demand will fall short of what was ordered.
Calculating Optimal Inventory Levels: A Practical Framework
Reducing excess inventory begins with replacing intuition-based ordering with a structured calculation. The following framework provides a workable starting point for most manufacturing and distribution operations.
Step 1: Establish true demand variability. Pull 12 to 24 months of actual sales data at the SKU level. Calculate mean demand and standard deviation per period. This data is the foundation for every subsequent decision.
Step 2: Quantify lead time variability. International suppliers do not deliver on a fixed schedule. Measure average lead time and its variance across your last 20 to 30 purchase orders. A supplier that averages 75 days but swings between 55 and 100 days requires a different safety stock calculation than one that consistently delivers in 70 to 80 days.
Step 3: Define your target service level. What stockout rate is commercially acceptable? A 95 percent service level requires less safety stock than 99 percent. This is a business decision with a quantifiable cost implication—and it should be made explicitly, not by default.
Step 4: Apply the safety stock formula. A standard approach uses the formula: Safety Stock = Z × σ(lead time demand), where Z is the service level factor and σ represents the standard deviation of demand during the lead time period. More sophisticated models incorporate lead time variability directly into the calculation.
Step 5: Set reorder points accordingly. Reorder Point = Average Demand During Lead Time + Safety Stock. This replaces gut-feel ordering with a defensible, data-driven trigger.
Running this analysis across a full product catalog often reveals that certain SKUs have been systematically overstocked for years—not because of genuine demand uncertainty, but because no one ever formally calculated what the right level was.
Renegotiating the Relationship: Consignment and Vendor-Managed Inventory
Beyond internal inventory optimization, US manufacturers have meaningful leverage to shift inventory risk back toward their international suppliers through contractual arrangements—if they are willing to negotiate for them.
Consignment inventory is an arrangement in which the supplier retains ownership of goods stored at or near the buyer's facility until those goods are consumed or sold. The buyer does not pay until the inventory is used. This eliminates the working capital drag associated with holding paid-for stock that has not yet generated revenue. It also aligns the supplier's financial interest with actual consumption rather than maximum shipment volume.
Vendor-managed inventory (VMI) goes further. Under a VMI arrangement, the supplier takes on responsibility for monitoring stock levels and triggering replenishment. The buyer shares real-time consumption data, and the supplier manages the reorder process within agreed parameters. This can dramatically reduce the administrative burden on the buyer's procurement team while also giving the supplier better demand visibility—often resulting in more accurate production planning and fewer emergency orders.
Neither arrangement is universally available, and both require a supplier relationship mature enough to support data sharing and contractual sophistication. But for US manufacturers who have established long-term partnerships with international producers, these structures are increasingly achievable—and the financial benefits can be substantial.
From Cost Center to Competitive Lever
Inventory is not inherently a liability. Managed well, it enables service levels that competitors cannot match and provides a buffer against genuine supply disruptions. The goal is not to eliminate inventory but to hold the right amount—no more, no less.
US manufacturers who apply rigorous calculation to their international supply chains, and who actively negotiate inventory-sharing arrangements with overseas partners, consistently find that they can reduce carrying costs, free working capital, and improve cash flow without compromising their ability to serve customers.
The hidden inventory tax is real. But unlike most taxes, this one is optional—for companies willing to do the analytical work to eliminate it.